

Article 1 — The Foundations
How this series started.
A few months ago, we, at Sigma Software Design, sat down with a recruiting lead who has run 200+ interviews with designers in recent years. We asked, “What’s the weakest skill you see in candidates?” She didn’t hesitate: estimating projects by being able to size the work, list dependencies, and call out risks. That answer stuck. This series exists to help fix that gap so designers can estimate creative work with confidence and keep ideas both inspiring and shippable.
To make it real, we decided to share our own experience: the wins, the mistakes, and the lessons learned while estimating actual projects. Our perspective shows what good estimation looks like in practice and how it can transform the way design work gets done.
No more guessing, let’s make estimating easy!
Why estimation matters in design (and why projects fail)
The word “estimate” often feels like a trap: you give a number, someone writes it into a plan, and suddenly it’s a promise. But estimates aren’t predictions. They’re tools for reducing uncertainty, setting expectations, and giving projects a better chance of success.
Why does this matter? Because projects rarely fail for lack of talent. They fail because of uncertainty, poorly defined scope, hidden dependencies, and approvals that drag. According to the Standish Group’s CHAOS: Beyond Infinity study:
- 31% of projects succeed,
- Nearly 50% are late or over budget,
- About 19% fail.
Estimates won’t magically fix these numbers, but they can surface risks early and create space for better decisions. Even an imperfect estimate builds structure and alignment.
And yet, designers often underestimate. We focus on the visible deliverables and forget the “silent tasks”: preparing assets, writing copy, cleaning files, documenting decisions, covering error states. Those details add up.
So, here’s the shift: estimation isn’t about being “right.” It’s about making uncertainty visible, building trust, and reducing surprises.
The six boxes every estimate should tick
A useful estimate looks beyond “how many hours.” It reflects the whole environment of the project. Six aspects make an estimate meaningful:
- Time. How long tasks and milestones may take.
- Scope. The boundaries of what will and will not be delivered.
- Cost. The budget is required to match the planned effort.
- Risk. Uncertainties or dependencies that could affect the outcome.
- Resources. People, tools, access, and other inputs needed for delivery.
- Quality. The standards that define “done right.”
When one of these is vague, surprises sneak in. When all six are explicit, teams make better tradeoffs.
Why estimates fail: common pitfalls, effort drivers, and accuracy curves
Work looks simple from far away. Once you start, the unknowns show up. There are recurring triggers that explain why estimates miss reality:
- High uncertainty. Limited information, vague requirements, unclear goals.
- Expectation gaps. Different people imagine different “finish lines.”
- Constant change. Scope grows, new stakeholders appear, and feedback loops expand.
- Thin practice. Lack of systematic estimating, risk analysis, re-estimation, or documentation.
- Optimism bias. We assume things will go faster and smoother than they usually do.
PricewaterhouseCoopers lists poor estimation among the top three causes of project failure, year after year.
A “quick redesign” grows into a strategy shift. Missing content blocks approval. A new manager arrives with new opinions. The mistake isn’t that estimates slip; it’s assuming they won’t.
Every estimate is shaped by effort drivers, factors that push work up or down. Naming them makes estimates more realistic and helps explain why something takes longer (or shorter) than expected.
- Complexity of the work. More flows, states, and interactions multiply effort.
- Scope and deliverables. Without clear boundaries, scope creeps silently, inflating timelines.
- Uncertainty and ambiguity. Early on, assumptions outweigh facts, so estimates should be ranges, not promises.
- Dependencies and stakeholders. The more decision-makers and external inputs, the slower the cycle. Approval latency is a real cost.
- Team experience and tools. Experienced teams and strong design systems accelerate work.
- Quality expectations. A quick test prototype is not the same as a polished, production-ready interface.
These drivers line up with the six classic dimensions: time, scope, cost, risk, resources, and quality, and they explain why projects drift when even one of them shifts.
Accuracy changes by phase: the cone of uncertainty
At the beginning of a project, accuracy is fragile. One reason estimates fail is that accuracy is not constant; it changes as the project evolves.
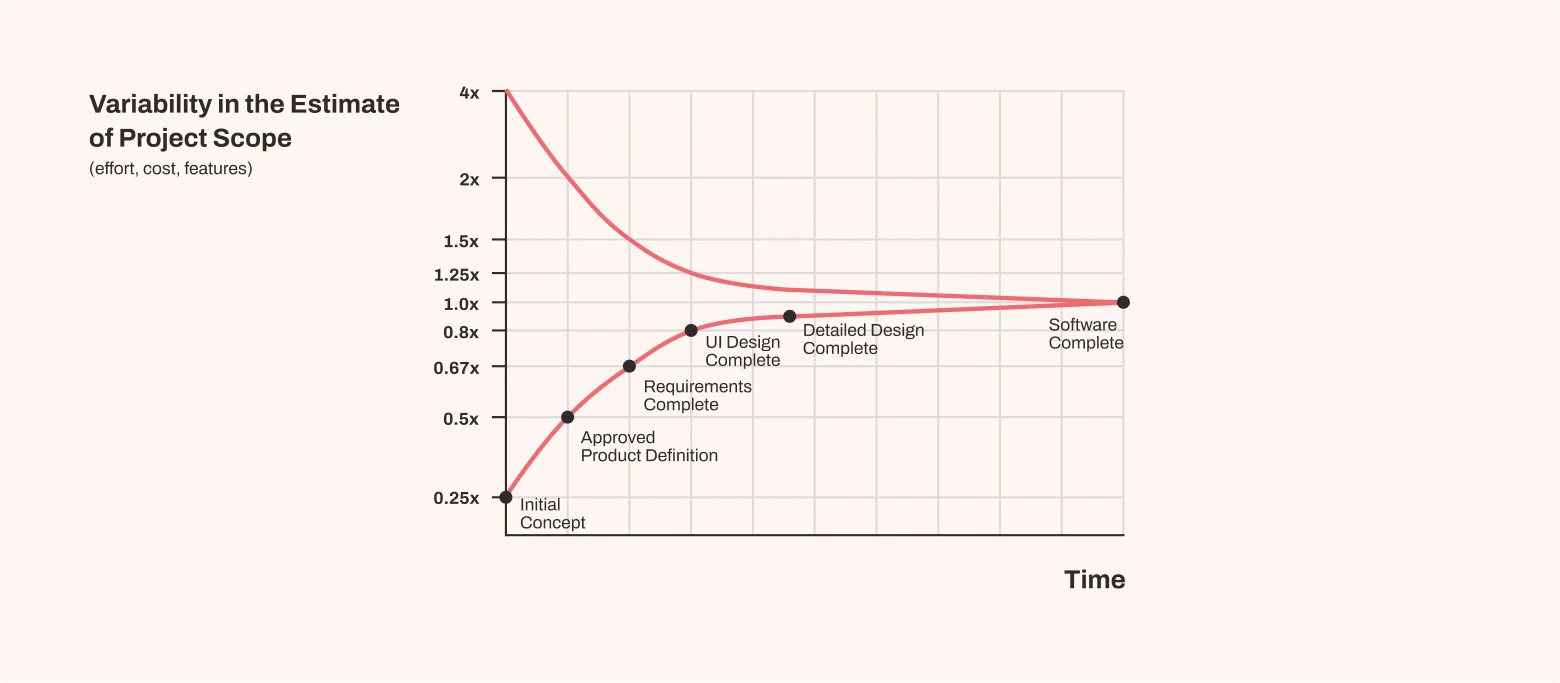
Accuracy across phases
- Initial (Concept/Discovery) → as much as +300% / –75%.
- Planning (requirements clarified) → about ±50%.
- Execution (detailed tasks) → about ±25%.
- Final (near delivery) → ±10% or better.
This is the cone of uncertainty: wide at the beginning, narrowing as clarity grows. Treat early estimates as ranges, not fixed numbers. Later estimates are more precise, but by then, flexibility is limited.
A key detail:
The cone of uncertainty doesn’t shrink on its own. Teams have to clarify requirements, break tasks down, prototype, test, and refine. Skip these steps, and estimates stay shaky until the end.
Breaking work into smaller pieces is the fastest way to improve accuracy. Still, uncertainty never disappears, and estimates can’t be perfect. But each action that removes assumptions narrows the range and makes outcomes more predictable.
The bell curve: why overruns are more common than underruns
If the cone shows accuracy over time, the bell curve shows how outcomes are distributed for a single estimate. From a probability view, an estimate is not a fixed number; it’s a distribution.
- The middle (peak) is the most likely outcome.
- The left side is the optimistic case (everything goes smoothly).
- The right side is the pessimistic case (delays, rework, blockers).
In design and product work, the curve is usually positively skewed. The right tail is longer than the left. Projects are more likely to take longer than shorter, because delays stack while “time savings” seldom compound. This is a quiet reason many teams feel they are always “a bit behind.”
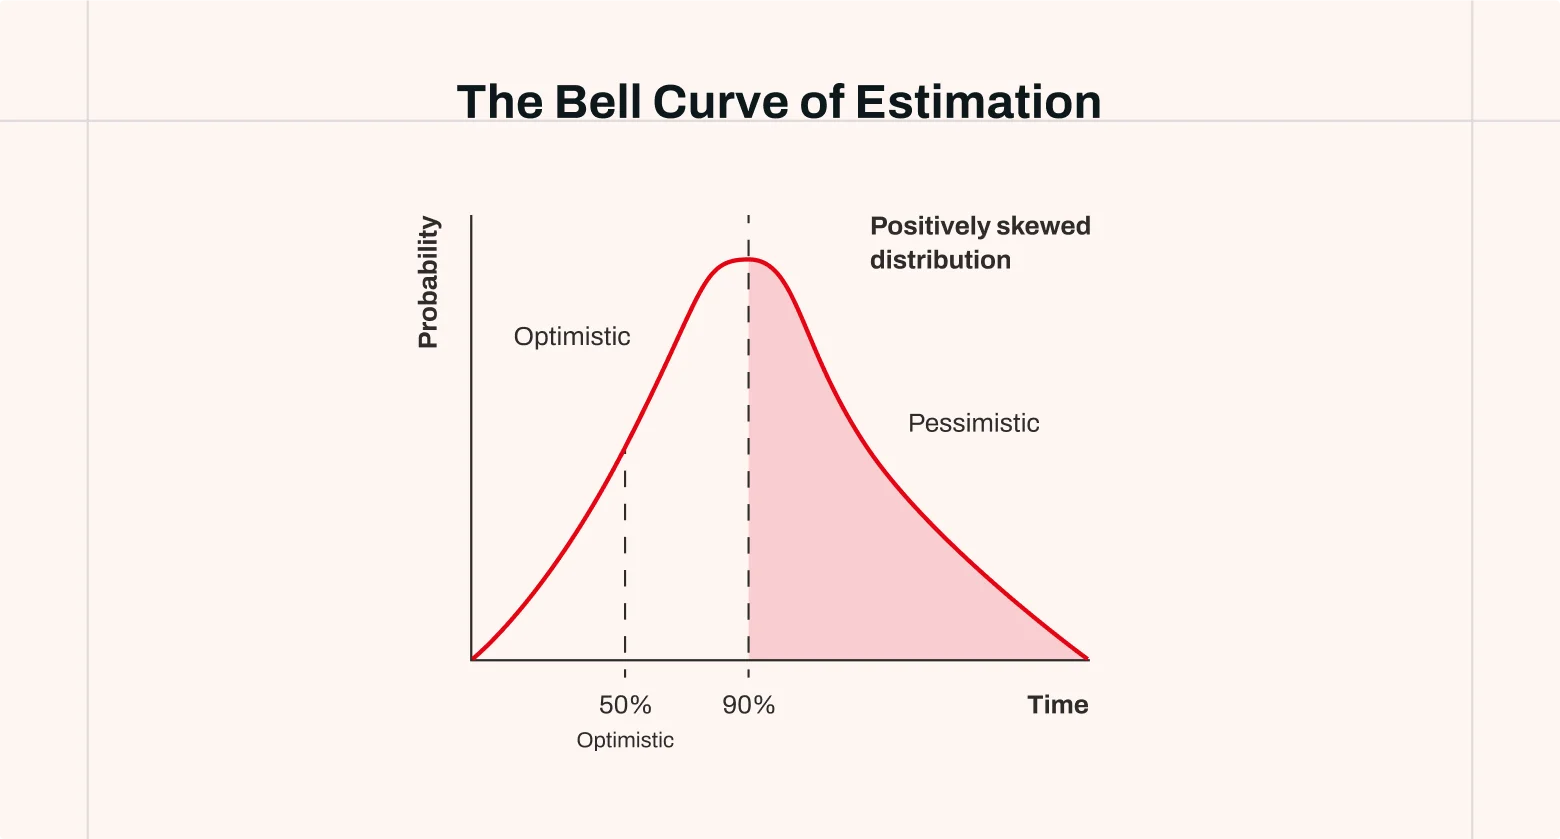
Cone + curve = the real picture. The cone illustrates how accuracy changes with knowledge, while the bell curve represents the spread around any single estimate. Together, they explain why estimates fail when treated as fixed promises. Later, we’ll examine practical techniques that apply this theory in practice.
Practical habits for better estimates
If you remember nothing else, keep these habits:
- Give ranges, not single numbers. A range acknowledges uncertainty and invites discussion.
- State a confidence level. “Two to three weeks at ~70% confidence” sets a tone for risk.
- Actively reduce uncertainty. Use discovery, prototypes, quick tests, and spikes to learn cheaply.
- Estimate the whole journey. Include discovery, feedback loops, testing, documentation, and rework.
- Account for stakeholder overhead. Meetings, approval cycles, and review rounds are real work.
- Use peer review. Ask a colleague to sanity-check your breakdown; they will spot missing tasks.
- Simulate the plan with stakeholders. Walk through the timeline to uncover misunderstandings early.
What not to do
- Don’t reduce estimates just to make them look better.
- Don’t dismiss small tasks; they add up.
- Don’t tighten numbers when uncertainty is high; the real fix is more discovery.
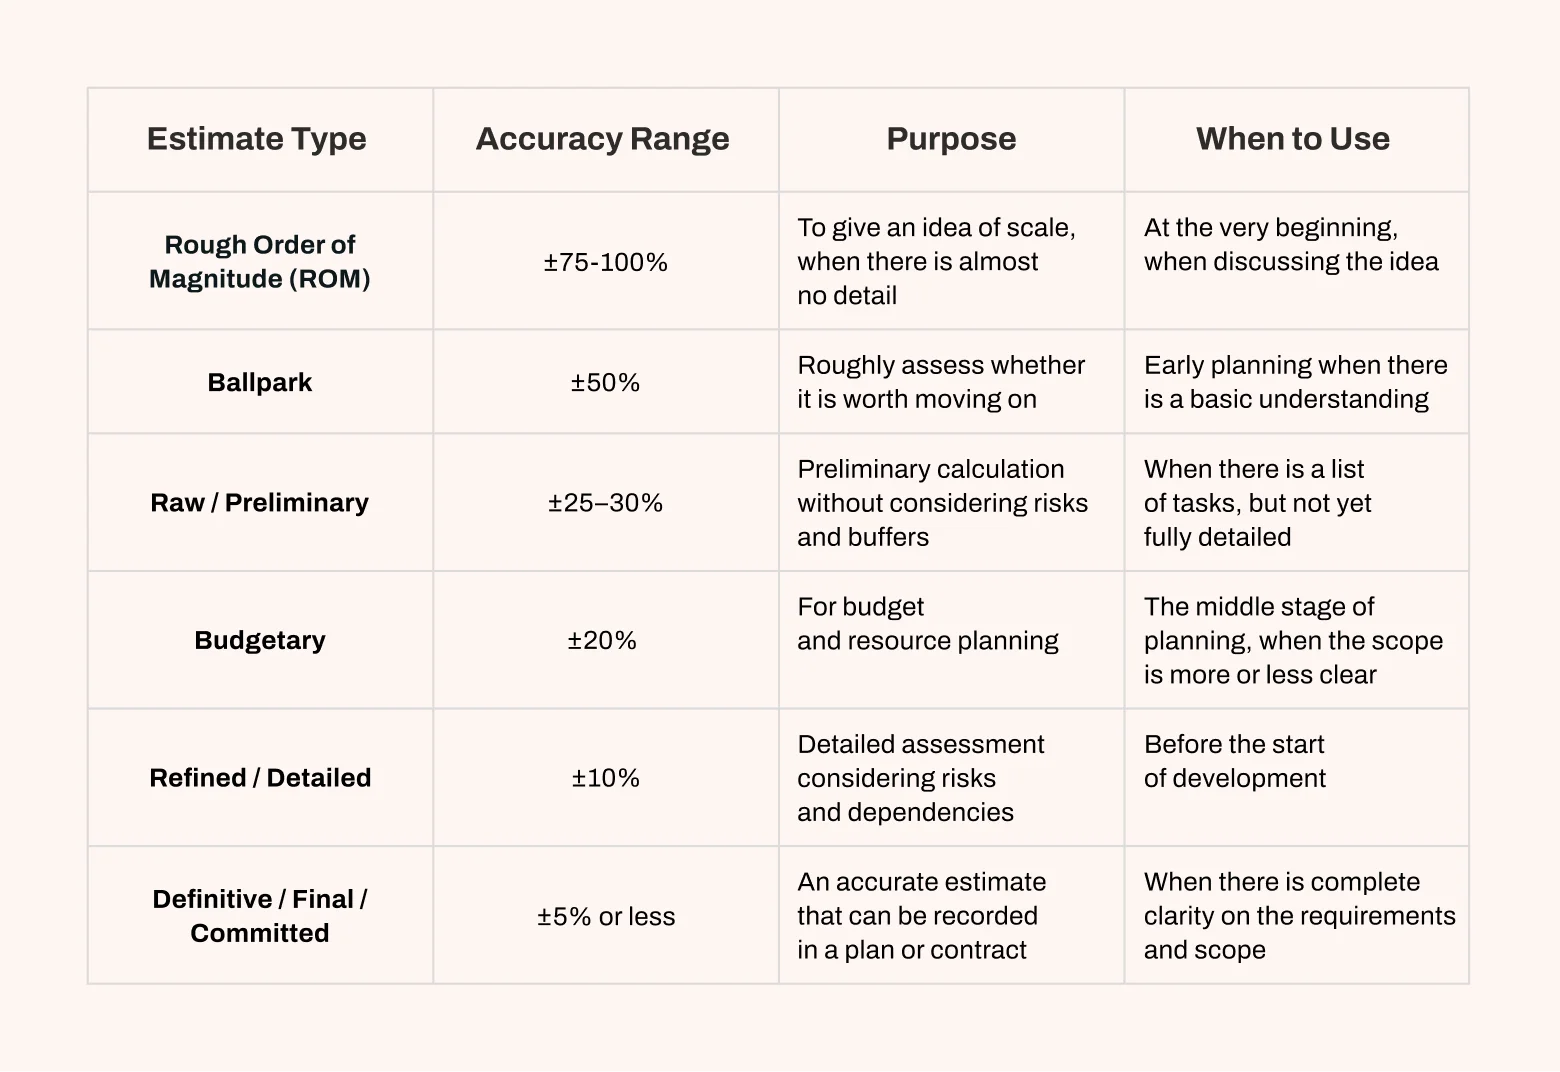
Estimate types: use the right tool for the moment
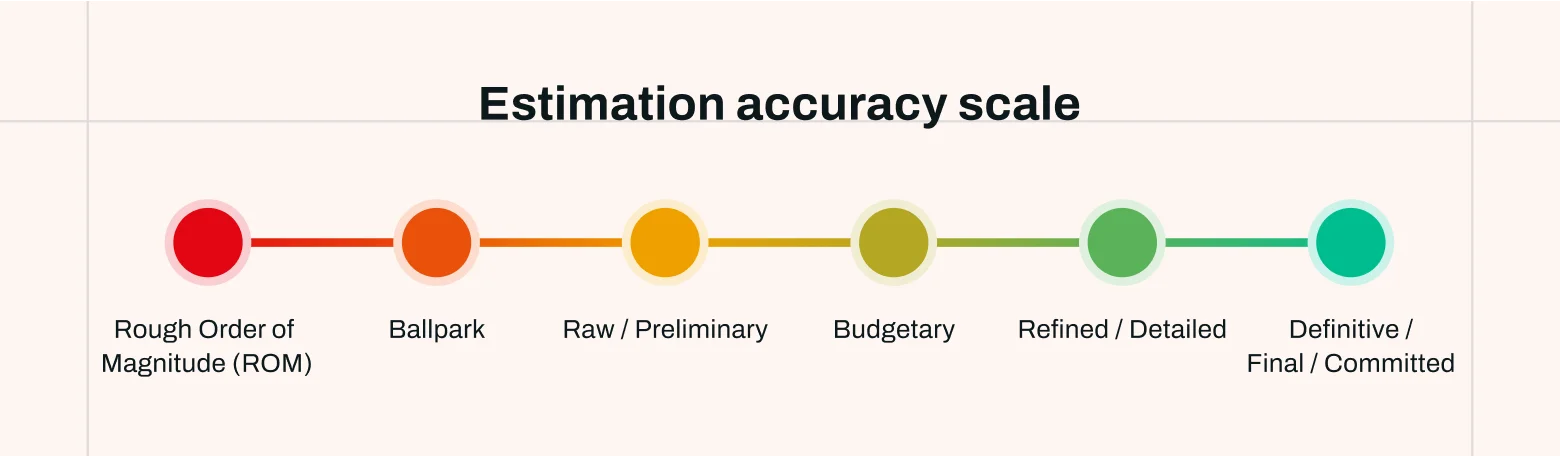
No estimate is perfectly accurate. That’s not a failure; it’s the nature of estimating. What matters is matching the type of estimate to the stage of the project and being clear about its accuracy.
Early numbers are broad because of the cone; they tighten as discovery reduces ambiguity. Within each stage, the bell curve reminds us that results lean toward overruns rather than underruns. Framing estimates as ranges with confidence is more honest than stone-carved promises.
Estimation methods you can mix and match
Understanding accuracy is half the story. The other half is how to produce estimates. Over time, several approaches have become common in product and project work. Each has strengths and limits; most teams mix them.
1. Expert judgment (top-down estimating)
How it works: experienced people provide estimates based on intuition and similar past work.
Strengths: fast, minimal documentation, useful early.
Limitations: subjective, prone to optimism bias, and hard to defend under scrutiny.
When useful: early discussions, executive planning, quick ballparks.
2. Analogous estimating (by comparison)
How it works: use data from similar past projects as a reference.
Strengths: quick, grounded in history, directionally helpful.
Limitations: accuracy depends on similarity; it can hide unique complexity.
When useful: organizations with reliable historical data in familiar domains.
3. Parametric estimating
How it works: apply a simple model based on measurable variables.
Example: if one feature typically takes 10 hours, then 15 features ≈ 150 hours.
Strengths: scalable, more objective, good for repeatable work.
Limitations: needs trustworthy metrics and consistent units.
When useful: projects with well-defined, repeatable tasks.
4. Three-point estimation
How it works: estimate Optimistic (O), Most Likely (M), and Pessimistic (P). Present as a range (O–P) or average them.
Strengths: simple, acknowledges uncertainty, shows realistic spread.
Limitations: doesn’t weight probability; all three points count equally.
When useful: early to mid-phase planning, when stakeholders need to see best/worst-case ranges.
Note: directly visualizes the bell curve (O on left tail, M at the peak, P on the right tail).
5. PERT (Program Evaluation and Review Technique)
How it works: builds on three-point estimation but weights the “Most Likely” case more heavily: E = (O + 4M + P) / 6
Strengths: probability-weighted, less skewed by extremes, closer to statistical modeling.
Limitations: still depends on judgment for O, M, and P; assumes a roughly normal distribution.
When useful: medium- to large-scale projects where uncertainty is significant, but a single number is expected.
Notes: fits with the cone (range narrows as knowledge grows) and the bell curve (M weighted near the peak).
6. Use Case Points (UCP)
How it works: break functionality into use cases, assign weights by complexity, and adjust for technical/environmental factors.
Strengths: structured, makes complexity explicit, scalable across systems.
Limitations: requires detailed requirements and calibration.
When useful: software/product works with definable functional units.
7. Bottom-up estimating
How it works: break scope into detailed tasks (a WBS), estimate each, then sum.
Strengths: detailed, transparent, higher accuracy in later stages.
Limitations: time-consuming, brittle if the scope is incomplete.
When useful: later stages, execution planning, and budget finalization.
No single method fits every situation. Start broad (expert/analogous), introduce parametric where repeatable units exist, fold in three-point/PERT for risk, and finish with bottom-up once the scope is firm.
Assumptions and risks: the part that breaks plans
Even the best method fails if it ignores the invisible forces around a project: risks and assumptions. Estimates don’t live in a vacuum; they’re built on what we think is true and on uncertainties that may or may not happen.
A familiar story. A team promises a feature in six weeks. Everyone nods; the schedule looks tight but doable. Unspoken assumptions sit inside that number:
- Content will arrive on time.
- Feedback will be quick (a day or two per round).
- Developers will be free when the designs are ready.
- Testing won’t reveal show-stoppers.
Two weeks in, content slips by a week. A stakeholder adds two extra review cycles. Developers get pulled to another priority. The six-week estimate dissolves.
The problem isn’t the team’s method; they might have used expert judgment, parametric, or PERT. The issue is that the estimate was built on invisible assumptions. When those failed, the plan unraveled.
A better way. State the assumptions out loud:
“We believe this is six weeks if content arrives on time, approvals take ≤2 days per round, and priorities hold. If any of those slip, expect 8–9 weeks. We’re adding a 20% buffer for that risk.”
Now the client hears a map of uncertainty, not a naked number. When delays happen, nobody is surprised, because they were visible from the start.
Common assumptions to make explicit
- “The client will deliver content on time.”
- “Feedback cycles will take no more than two days.”
- “We’ll have access to users for testing.”
- “Engineering will be available when the design is ready.”
If any of these proves false, the estimate collapses. Making them visible turns silent risks into known factors that can be managed.
Proactive communication beats last-minute overruns
Early estimates aren’t meant to lock budgets. At the start, assumptions outweigh facts, and numbers are loose. Turning them into commitments only creates conflict.
The safer path is proactive communication. As the scope or feedback grows, effort grows too. Don’t wait until money runs out. Flag changes early, explain why, and ask for adjustments before overruns pile up.
A plain example
“Our estimate assumed content delivery within two weeks. Since it’s arriving later, we project +2 weeks of design time. We recommend adjusting the timeline now to avoid surprises later.”
This reframes estimation from a one-time number into an ongoing dialogue. Few people love change, but most will respect transparency more than surprises.
Keep transparency simple
- Publish assumptions with every estimate.
- Define re-estimate triggers (e.g., new stakeholder, scope change, dependency blocked >3 days).
- Use ranges and keep the confidence explicit.
- Maintain a small change log (date, trigger, affected areas, time/scope/cost, and the decision).
Managing risk without padding
Risks affect scope, cost, schedule, or quality: stakeholder change, tool limits, new technologies, shifting priorities, resource bottlenecks, slow approvals, unclear requirements, and weak communication. Estimates usually need contingency:
- Known risks: add specific contingency time or budget.
- Unknown risks: add a general buffer (a common starting point is ~20%).
- High-uncertainty phases: use broader ranges instead of a hidden pad.
This is not about “padding just in case.” It’s about transparent uncertainty, so stakeholders see why extra time or budget is justified.
While project managers track risk, many design-specific risks emerge from the design process itself. Designers must surface them:
- Will the brand system limit creative options?
- Are there accessibility constraints that will require extra work?
- Which edge cases must be included now?
- Could missing content or data reshape the UI?
These questions rarely appear on a PM’s generic checklist, yet they make or break delivery. Clear ownership is key: designers spot design risks, managers track them. A tidy number with hidden risks is more dangerous than a rough range with risks in plain view.
A lightweight estimation workflow
Here’s a simple loop you can apply to real projects:
- Frame the work. Capture goals, constraints, and any known boundaries. List assumptions.
- Pick an estimate type. ROM or Ballpark for early talks; Preliminary when tasks are listed; Detailed/Definitive when scope is firm.
- Choose methods. Start with expert/analogous; layer parametric if units repeat; use three-point or PERT for risky items; finish with bottom-up.
- Include the silent tasks. Discovery, documentation, states/edge cases, file prep, handoff, and review cycles.
- Call out drivers and risks. Name the complexity, dependencies, quality bar, and stakeholder load.
- Present ranges with confidence. Note contingencies for known risks and a general buffer for unknowns.
- Set re-estimate triggers and keep a change log.
- Tighten as you learn. As discovery reduces uncertainty, narrows ranges, and updates confidence.
This loop is small enough to use weekly and strong enough to keep estimates honest.
Wrapping up
No estimate will ever be exact, and that’s fine. The point isn’t precision, it’s clarity and alignment: making hidden work visible, surfacing risks, and creating realistic choices.
In this first article, we explored:
- Why estimation matters and why it often fails.
- How accuracy shifts across project phases.
- The main types and methods of estimation.
- The importance of stating assumptions and risks.
In the next part, we’ll look at the foundation of all good estimates: defining requirements before sizing them.
Because you can’t measure what you haven’t defined.
%202.webp)

.webp)