

This is the third article in the series, and this time we’re applying the method to a real example.
If you’re looking for the reasoning and structure behind this method, the previous article explains how discovery, scoping, and risk assessment shape the estimate.
Let’s walk through a small corporate website with five pages (Home, About & Team, News, Services, Contact Us) to see how the estimation method unfolds step by step. The goal here is not to overcomplicate a straightforward project but to demonstrate how Design Points and PERT method turn a guess into a structured estimate.
Step 1. Estimate Design Points (DP)
Design Points combine four inputs:
- Actors (who we design for)
- Screens/pages (what we design)
- Technical complexity (how hard the UI is)
- Environment/process complexity (how hard collaboration is)
The formula is simple:
DP = (UAW + UUCW) × TCF × ECF
Where: UAW = Actor complexity, UUCW = Page complexity, TCF = Technical Complexity Factor, ECF = Environmental Complexity Factor
Let’s walk through each part.
1. Actors (UAW)
For a basic company website, user types (actors) are simple:
- General visitor → Simple (1)
- Potential client → Simple (1)
Even if both use the same interface, their goals and interactions differ, so they count as separate actors.
UAW = 1 + 1 = 2
2. Pages (UUCW)
We assign weights based on complexity:
Simple page → 5 points
Average page → 10 points
Complex page → 15 points
For our five pages:
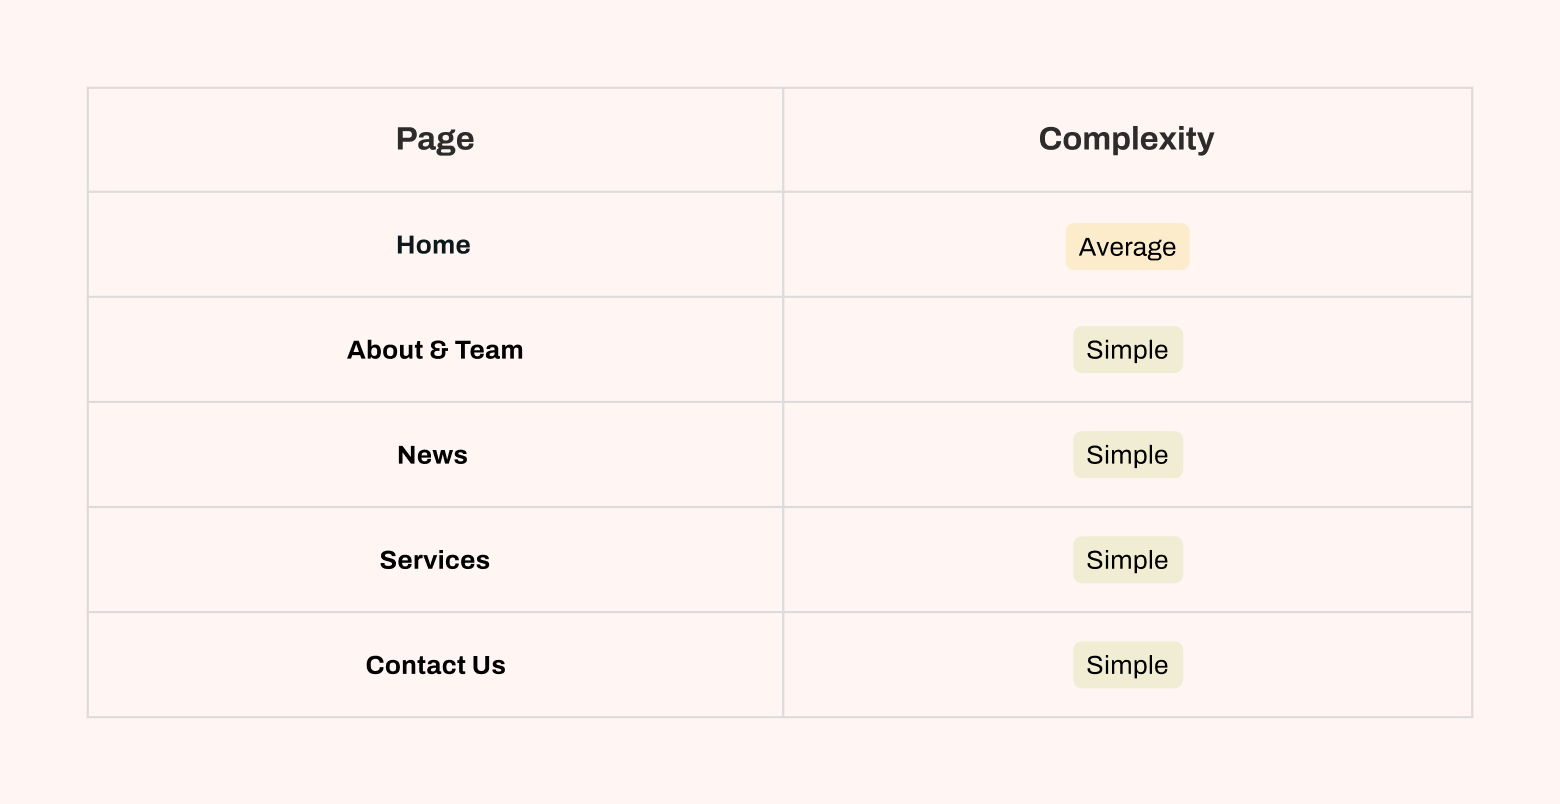
UUCW = 10 + 5 + 5 + 5 + 5 = 30
3. Technical Complexity (TCF)
Corporate websites are usually low-to-medium technically:
- Responsive layouts: moderate
- Interactive forms: simple
- No integrations, dashboards, animations, or data visualizations
TCF (Technical Complexity Factors) TCF=0.6+(0.01×∑(Fi×Wi))
Fi — factor rating (0–5, where 0 = not important, 5 = critical) Wi — factor weight (Wi = 0.5 → the factor has a weak influence, but is considered a nice-to-have.
Wi = 1 → the factor has a moderate influence.
Wi = 1.5 → the factor significantly complicates the work.
Wi = 2 → the factor is critical, affecting every aspect of the design.)
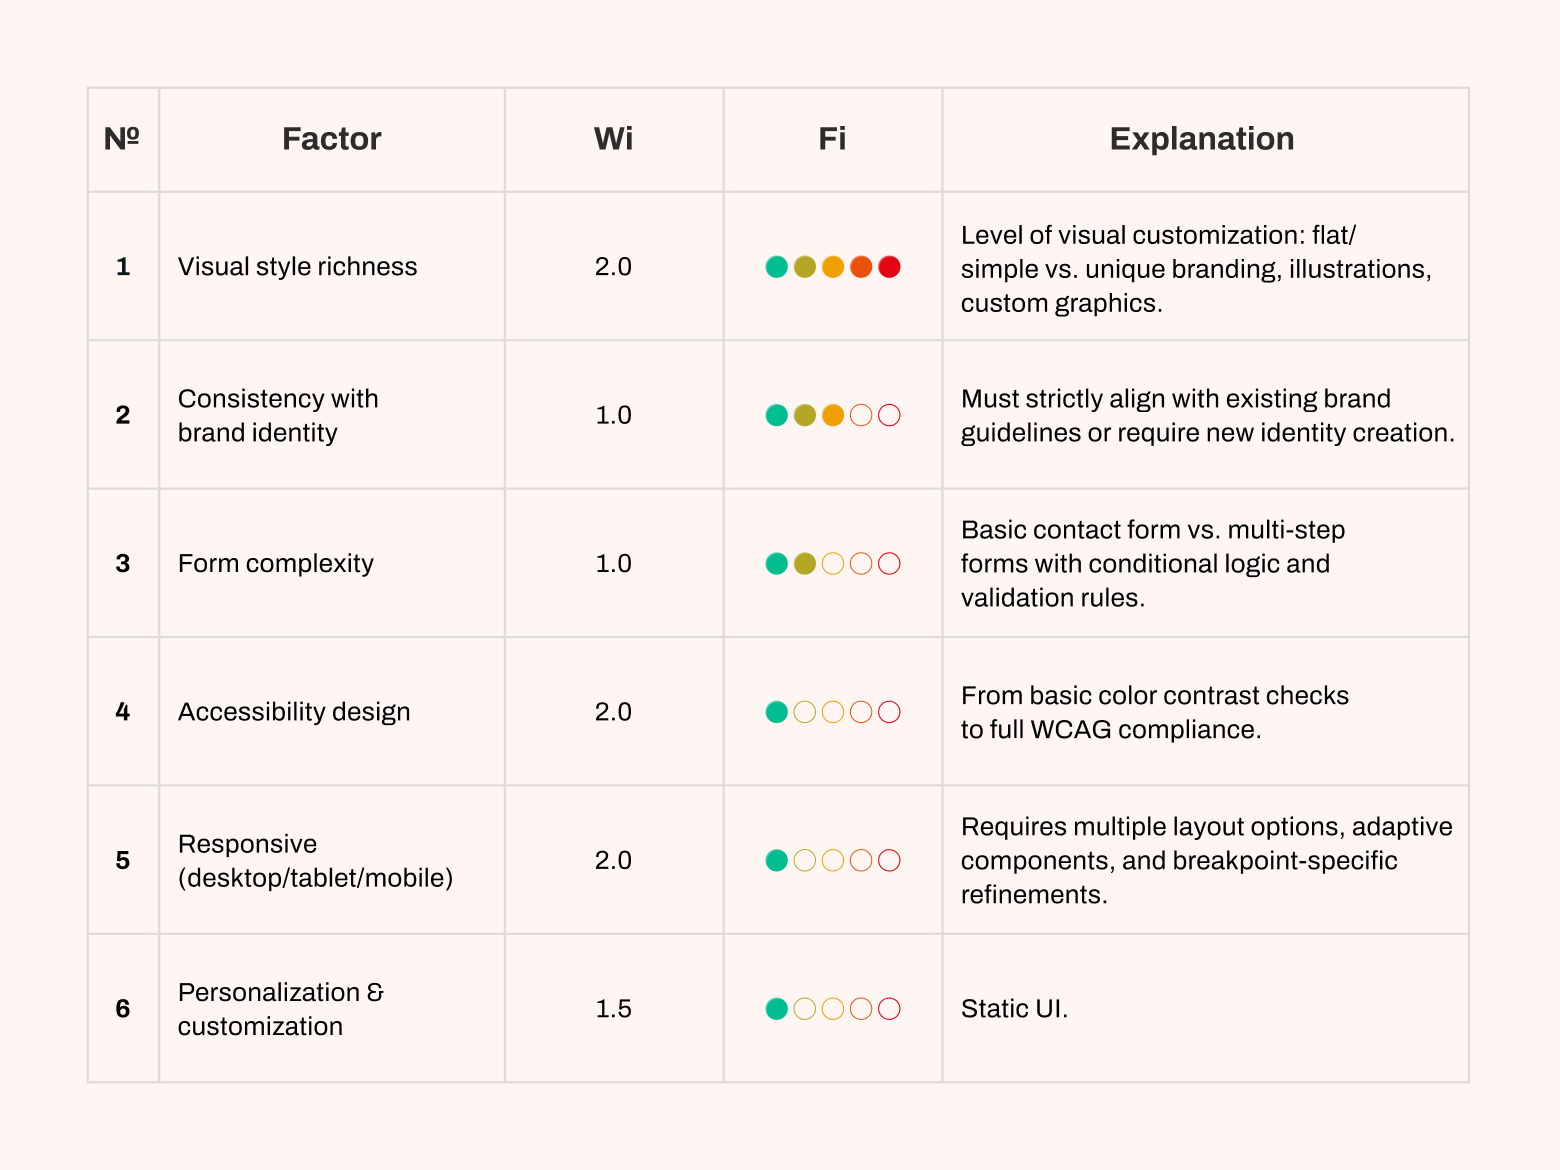
This gives us a TCF of ~0.805. On our internal scale, a simple marketing website like this usually falls between 0.8 and 0.9, which helps us calibrate effort realistically.
4. Environmental Complexity (ECF)
Let’s assume:
- Small team
- Few stakeholders
- Stable requirements
- Smooth Handoff
ECF=1.4−(0.03×∑(Fi×Wi))
Fi — factor rating (0–5, where 0 = not important, 5 = critical)
Wi — factor weight (Wi = 0.5 → the factor has a weak influence, as a nice-to-have.
Wi = 1 → the factor has a moderate influence.
Wi = 1.5 → the factor significantly complicates the work.
Wi = 2 → the factor is critical, affecting every aspect of the design.)
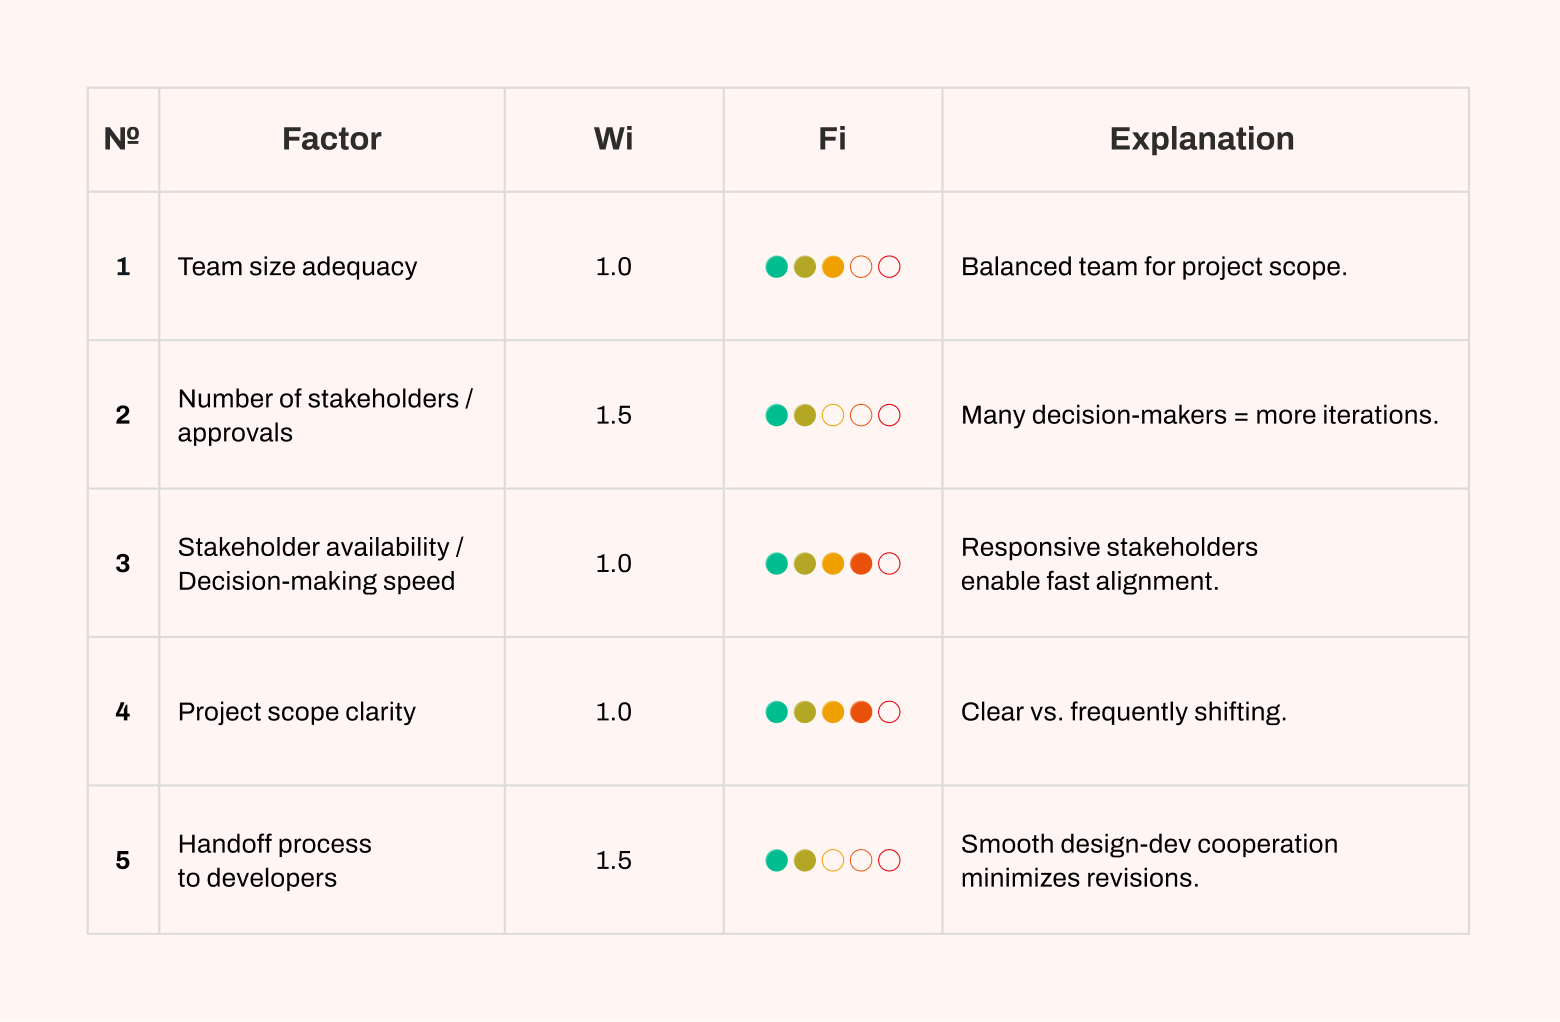
This produces ECF ~0.89 ~0.9
Applying the DP formula:
DP = (UAW + UUCW) × TCF × ECF
DP = (2 + 30) × 0.805 × 0.9
DP ≈ 24.5 Design Points
Each team has its own delivery rate. A common benchmark is 5 hours per Design Point, so let’s assume this and include it to calculate hours.
Most likely (M) ≈ 24.5 × 5 = 122.5 hours
Step 2. Apply PERT
We set a realistic range:
- Optimistic (O) ≈ 110 hours
- Most likely (M) ≈ 122.5 hours
- Pessimistic (P) ≈ 147 hours
PERT = (O + 4M + P) / 6
PERT ≈ 124.5 hours
So the final estimate becomes:
Expected effort ≈ 125 hours
Realistic range ≈ 110 to 147 hours
Instead of guessing a single number, you now have a range grounded in structure, complexity, and probability.
Final thoughts
This example shows how the method behaves with a real project, not a theoretical one. By running a small website through DP and PERT, you can see how actors, pages, complexity, and environment shape the final number. You also see how the PERT range brings realism into the estimate without overcomplicating the process.
The goal of this method isn’t to present the “perfect” number. It’s to show how a structured model turns a simple request like “design five pages” into a clear, explainable estimate. Once you understand the steps, you can apply the same approach to larger sites, apps, or more complex products.